 Products






Ready to get started?
No matter where you are on your CMS journey, we're here to help. Want more info or to see Glide Publishing Platform in action? We got you.
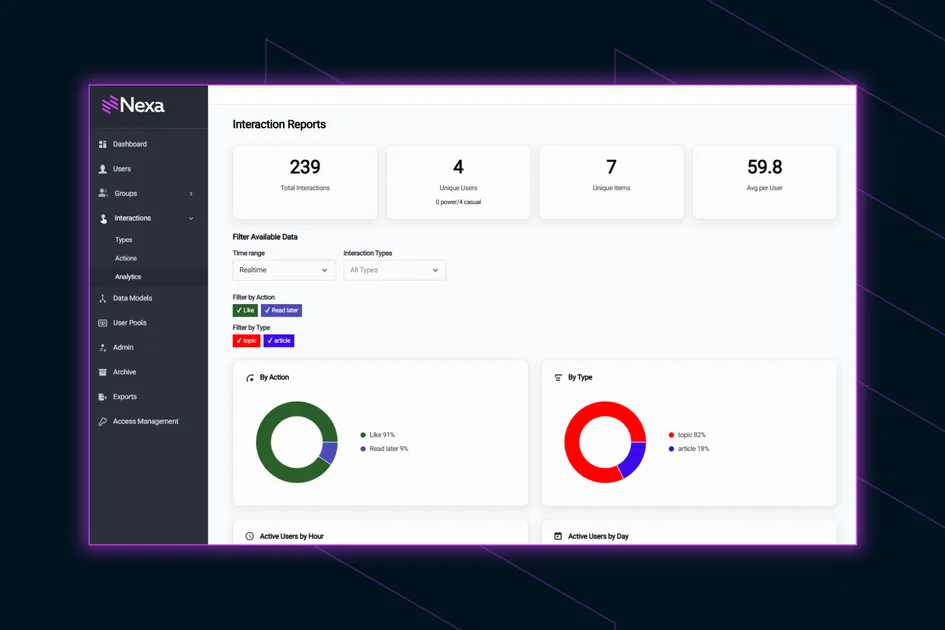
Book a demoMost organizations measure engagement in aggregate: pageviews, sessions, and bounce rate, none of it tied to a person. Glide Nexa records every interaction against a known reader and turns it into analytics you can act on, from weekly time-of-day patterns to a per-reader activity view.
Engagement is the metric organisations talk about most and measure least well. The standard analytics stack counts pageviews, sessions, scroll depth, and time on page, but it counts them for anonymous traffic, in aggregate. You can see that engagement rose last week, but you usually can’t see who drove it, what they engaged with, or whether they will come back.
The problem isn’t a shortage of numbers, it’s that the numbers aren’t attached to anyone. When every metric describes a crowd rather than a reader, engagement stays an editorial talking point, rather than a signal you can act on: which readers are forming a habit around your content, which ones are drifting away, or which are behaving like they’re ready to pay.
Glide Nexa is Glide Publishing Platform’s audience platform that keeps identity, interactions, preferences and entitlements on a single audience profile. Because every interaction is recorded against that known profile, engagement analytics in Nexa are built on people, not pageviews. They show who engaged with what, and when, in a form that points to a next action.
Nexa's engagement analytics are built for the teams that act on engagement, such as content, marketing, subscriptions and commercial teams, in any organisation with an audience.
Standard web analytics were built to measure traffic, not relationships. They treat each visit as a largely anonymous event and roll those events up into totals. That model answers “how many” well but it can’t answer “who”, because it never knew who the reader was. The moment you want to connect this week’s engagement to a specific person’s subscription status, or last month’s activity to whether they’ll renew, the model runs out of road.
Teams usually respond by bolting on more tools. an analytics platform for behaviour, a subscription system for payment, an email tool for opens, a CRM for records. Each holds a fragment of the engagement picture, and none of them agrees on who the reader is. Stitching those fragments into a single view of one reader is slow, expensive, and often not possible at all.
The result is that engagement, the thing organisations most want to grow, is measured in the least actionable way: a crowd-level trend line with no reliable path to a decision about a real reader.
The result is that engagement, the thing organisations most want to grow, is measured in the least actionable way: a crowd-level trend line with no reliable path to a decision about a real reader.
There's no fixed list of interactions. Likes, saves, and follows come built in as a starting point, and you can define any other activity type you want to track.
These aren’t rolled into a single activity count. A save on a match report at 8am and a share of an analysis piece at 10pm are distinct, queryable records, each tied to a specific reader and a specific piece of content.
That structure is the difference between Nexa’s engagement data and a generic event counter because each interaction knows:
The analytics built on top can slice engagement along any of those four lines. “Engagement went up” can become “saves on long-form analysis rose 20% this month, mostly in the evening”, a sentence you can plan around.
Because each interaction attaches to a known, authenticated profile, the data isn’t just structured, it’s personal in the useful sense: it belongs to someone you can recognise next week.
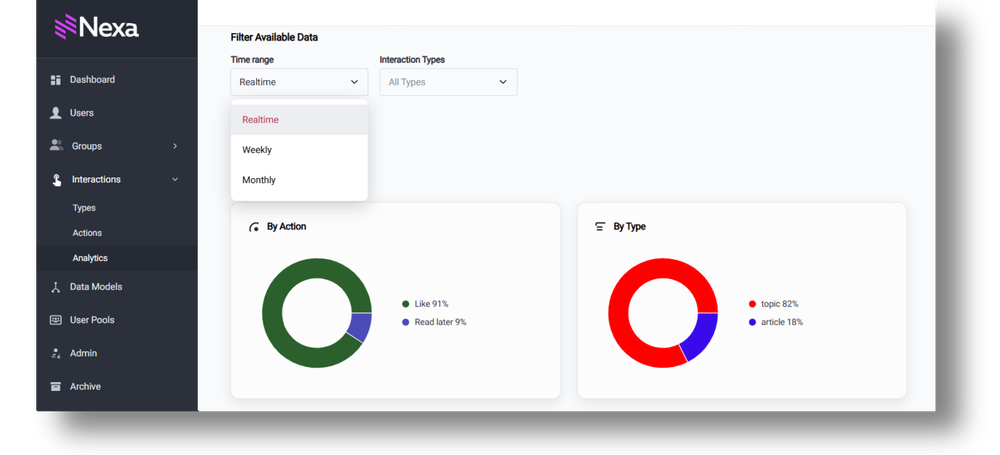
Weekly and monthly snapshots
Engagement is summarised on a weekly and monthly, so you see movement over time rather than a single live figure that says nothing about direction. Snapshots make trends legible: engagement climbing after a redesign, a content area quietly losing traction, a seasonal rhythm you can plan around. A live counter tells you where you are, snapshots tell you where you’re heading.
Breakdowns by interaction type and action
Instead of one blended score, you see the shape of engagement: how much is saving, following, or any other activity type you've defined. Action adds a second dimension. A save signals “I want to come back to this”; a share signals “I want others to see this”. A section that attracts lots of shares but few saves is being passed along rather than returned to, which tells you something specific about how readers value it.
Time-of-day patterns
Engagement is reported against when it happens, which surfaces the rhythms of your actual audience: when they read, when they save, when they act. That feeds scheduling decisions such as when to publish, when to send the newsletter, and when to fire a notification, so content lands when your audience is engaged rather than when it’s convenient to hit publish.
Top-performing content
Nexa surfaces the content items driving the most interactions, judged by real engagement actions tied to known readers rather than raw traffic. This is often a more honest picture than a page-view chart. A piece can pull a large anonymous audience and generate almost no engagement, while a quieter piece earns saves, shares, and follows from readers who value it. The former looks good in traffic reports, while the latter is building your audience relationship
Per-user activity summaries
Each reader’s engagement is summarised across three windows: the current week, the last 30 days, and all time. A conventional analytics stack cannot produce this report, because it never knew who the reader was. It shows how a specific reader’s engagement is trending: ramping up, holding steady, or falling away. That view is what makes the next section possible.
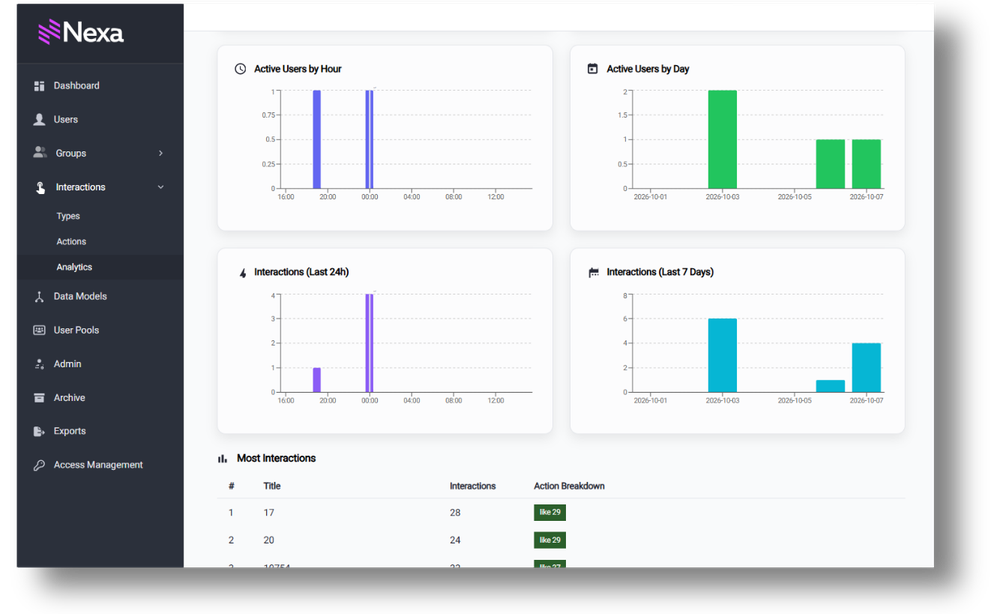
Analytics you can’t act on are decoration. Tying engagement to known readers means each pattern points to a next move, and the per-reader view is what makes intervention possible.
Sport people ready to upgrade, and people drifting away
Take a reader whose activity has climbed steadily across the last 30 days: more reads, more saves, following new topics. That trajectory marks them as a candidate for an upgrade prompt or a deeper subscription tier, because their behaviour, not a guess, says they’re invested.
Now take the opposite: a reader who used to engage several times a week, whose activity has thinned out. That’s an early warning you can act on before they lapse, rather than a fact you discover after they’ve cancelled.
Plan content and distribution around real behavior
The type-and-action breakdown feeds editorial planning. If saves and shares cluster around one content area, that’s where reader value sits and where more of your team’s effort will pay off. The time-of-day patterns feed scheduling, so publication and distribution match your audience’s real rhythm. Top-performing content, measured by genuine engagement rather than traffic, shows what’s worth doubling down on versus what merely drew a crowd.
Make engagement a shared commercial asset
Because the same profile carries identity, preferences and entitlements alongside this engagement data, the analytics reach beyond editorial and content teams. When an ad sales team says “our audience is highly engaged”, that claim can be backed with evidence from a single source. When a subscriptions team wants to know who’s most likely to convert, the engagement patterns sit against known readers rather than being inferred from anonymous behaviour. Engagement stops being an editorial vanity metric and becomes a shared commercial asset.
Nexa generates engagement analytics from the same profile that holds identity, interactions, preferences, and entitlements. That is why it can tell you that the person who engaged heavily last week is the same one whose subscription lapses next month: the analytics, subscription, and email data share one identity.
Every data point is tied to a known user, an action, a timestamp and a content item, which makes it auditable and, when you need it, portable. User data exports are configurable in CSV, JSON and XLSX, with additional data such as subscriptions and groups, plus field selection and permission controls. The data can flow to reporting dashboards or partners without you leaving the platform to assemble it.
There’s a compounding benefit to holding it all in one place. Engagement analytics get richer as more of a reader’s activity flows through the same profile.Each new touchpoint, such as a commenting system, a poll, or a newsletter, adds to the same engagement picture rather than starting a disconnected one. The longer a reader is known to Nexa, the more complete and more useful their engagement history becomes.
First-party data you own
The shift is from measuring a crowd to understanding readers. Once engagement is attached to people rather than page views, it stops being a number you report after the fact and becomes something you can act on while it still matters.
To see how engagement analytics in Nexa fit your audience strategy, connect with a Glide product specialist.
How is this different from Google Analytics or a standard analytics tool? Standard web analytics measure anonymous traffic in aggregate: page views, sessions, and bounce rate, with no reliable link to the person behind the behavior. Glide Nexa records interactions against a known, authenticated profile, so its analytics tell you who engaged, with what, and when, not just how much engagement happened across the crowd. The two do different jobs: one measures traffic, the other measures readers.
What counts as an interaction? Any recorded reader action: likes, saves, and follows as standard, plus any custom actions you define. Each one is captured in real time with its type, action, timestamp, and the content item it relates to.
Can I see engagement for an individual reader, not just totals? Yes. Per-person activity summaries cover the current week, the last 30 days, and all time, so you can see how one reader's engagement is trending rather than only the audience-wide picture. This is the part a conventional analysis stack can't offer.
Can I get the data out of Nexa? Yes. Exports are configurable in CSV, JSON and XLSX, with field selection and permission controls, so engagement data can feed reporting dashboards, advertising partners, or other systems.
Is this engagement data first-party? Yes. It's collected on your platform, tied to your authenticated readers, and owned entirely by you. It doesn't depend on third-party cookies, so it doesn't erode when browser policies or platform terms change.
Does it work if we're not on Glide CMS? Yes. Glide Nexa deploys independently of any CMS and connects via API, so engagement analytics work whether you're on Glide CMS, WordPress, or a bespoke platform. It integrates more tightly with Glide CMS, but a CMS migration isn't a prerequisite.
No matter where you are on your CMS journey, we're here to help. Want more info or to see Glide Publishing Platform in action? We got you.
Book a demo
